Some Points on Climate

This touches a number of recent climate issues—some new, some familiar.

Background

  1. The primary issue for climate change is alternative energy sources.

We’re not repealing the industrial revolution.

This shouldn’t be a partisan or a lifestyle issue

We need good science and the will to fight entrenched special interests

  1. Conservation is important for now but not the main focus

Alternative energy will do the job if we do ours.

Chevy Suburbans are not the issue—we just need to power them differently

 “Respect for nature” by primitive peoples is irrelevant (but coming from all directions!)

  1. This is a fundamentally international problem where what we do for the rest of the world is as important as what we do domestically.  We will need to spend money on parts of the world who can’t.

s11_2018_Projections

  1. The fossil fuel companies have an evil influence on progress, but outrage at what they knew 50 years ago is a distraction.

Oil isn’t unclean—we just went too far with it.

The Carter era thought the world was running out of oil in less than 50 years

               The key issue is influence of fossil fuel companies now.

  1. Conversions of coal power plants to gas are still important—they buy time

We’re up against a carbon budget limit—any saving buys time

Progress is still rapid for alternative energy technologies—even electric cars aren’t ready for everyone yet.

Coal plants, especially new ones, continue to be a problem.

  1. We should stop calling a carbon pricing a tax.

We need to stop the huge fossil fuel subsidy—$1 T per year in the US—that comes from using the atmosphere as a free carbon dump.

We need a plan to make the population whole—and earn the trust we will do it

History and politics

  1. Obama actually did quite a lot for climate

International unanimity (after many years of failure)

A process to do more in the future

Turning China around (look at China’s line on the emissions chart above)

               Seed funding for Tesla and subsidies for electric cars

Note—the US was the primary beneficiary of the Paris Agreement.  We’re not being told to stop emitting at twice the rate of anyone else!

s12_Top_FF_Emitters_percapita

  1. Trump’s effect on progress is far worse than acknowledged

Reversed progress on all environmental issues in the US

Broke international unanimity—okay for everyone including China, Japan, and Germany to backslide with coal power plants

Legitimized attacks on climate action everywhere (Australia)

Continues to block any international cooperation on any issue

Going forward

  1. The single most important action is to defeat Trump

He is a roadblock to progress by anyone’s definition.

Any of the Democratic candidates would be good—no one has a real plan yet anyway

  1. The Green New Deal delivers a necessary coalition for progress

Makes clear that the new world is a good place to be.

Unites all constituencies

Must eventually add carbon pricing.

Not yet a plan

  1. The youth climate movement is helpful but a little worrisome

Non-partisanship makes it easy to co-opt—speakers at rallies dismiss all establishment parties.

               Trump was (in part) elected by young people who thought voting didn’t matter.

  1. If we can get past Trump, then we all need to get serious about a real plan

consumption-by-source-and-sector

Needs to address our current usage

Make sure it happens–what to fix when and by whom

               Minimize the hurt (particularly for the disadvantaged)

Recognize full international responsibilities

Don’t expect climate efforts to fix everything.  Broader issues include:

Easing workforce disruptions from technology, globalization, etc. (not just from climate)

Education

Infrastructure (much more than climate)

Jobs and wages (unions, minimum wage, role of the public sector)

Racism and sexism (need rules for everywhere)

Inequality overall (need a tax plan)

Other environmental issues will still be there to be solved

Climate Change is Not Complicated

The reason for this note is that discussions of climate change have splintered into so many directions that the subject appears more daunting than it ought to be.  Neither the current status nor the path to success is actually hard to see.  The main things we need are commitment and a real plan.

  1. Current status

– Evidence for climate change is clear and unambiguous.

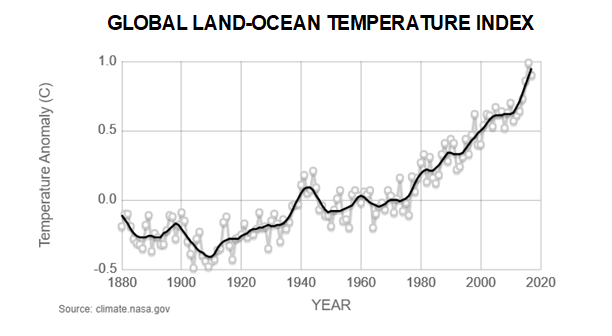
The increase in global temperature levels goes back decades, as shown in the following chart (Temperature Anomaly just means the temperature increase over 19th century levels).

noaa_temp

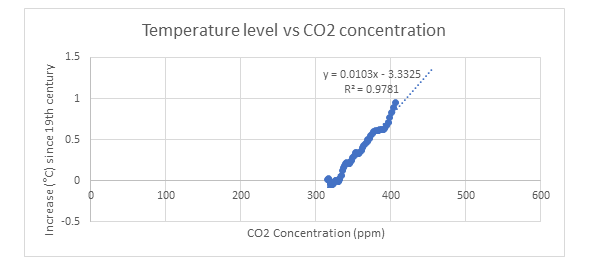
Further the relation of temperature and CO2 in the atmosphere is unmistakable (see the straight line below) and pushing up inexorably toward the identified 1.5 ºC danger zone:

temp_ppm

Scientists have even demonstrated (using isotopes of carbon) that the increased carbon dioxide in the atmosphere is due to burning of fossil fuels, not some natural process.  Arguments to the contrary have been largely funded by the Koch organization or the oil companies themselves and typically involve doctored data.  Accusations of conspiracy have been debunked, but are still repeated by interested parties.

– Problems are already happening.

There are two kinds of examples.   For temperature alone, as the first chart showed, we’re continuing to set new records for average global temperature.   The effect on sea ice has been dramatic, and farmers are becoming well-aware of changes in growing seasons.

Individual catastrophic events are harder to pin down, just because it’s hard to develop statistics around rare events.  However, scientists have been able to work through the statistics to show the extent to which extraordinary storms, such as hurricane Harvey, were made worse by climate change.

– Role of climate models.

We don’t need climate models to say there is a problem.  We do need climate models to assess specifically what is going to happen.  For example, we can see that glaciers in Greenland and Antarctica are melting, but we need to figure out how quickly this can happen and what the effects will be on weather and ocean currents.  Since the earth hasn’t been here before (i.e. rapid C02 increase like this has never happened), we have to try to figure it out.

A particular concern is that climate change feeds on itself to accentuate the effects of CO2.  An example is melting of permafrost in the arctic.  That releases methane, which is also a greenhouse gas and adds to the increase expected with CO2.  Climate models are extremely detailed to deal with such effects.  The modeling work is supported by a global effort to get data on what is happening now.  This is a major effort by many independent researchers worldwide to get the best possible handle on what’s coming.

– It’s going to get a lot worse unless we start acting now.

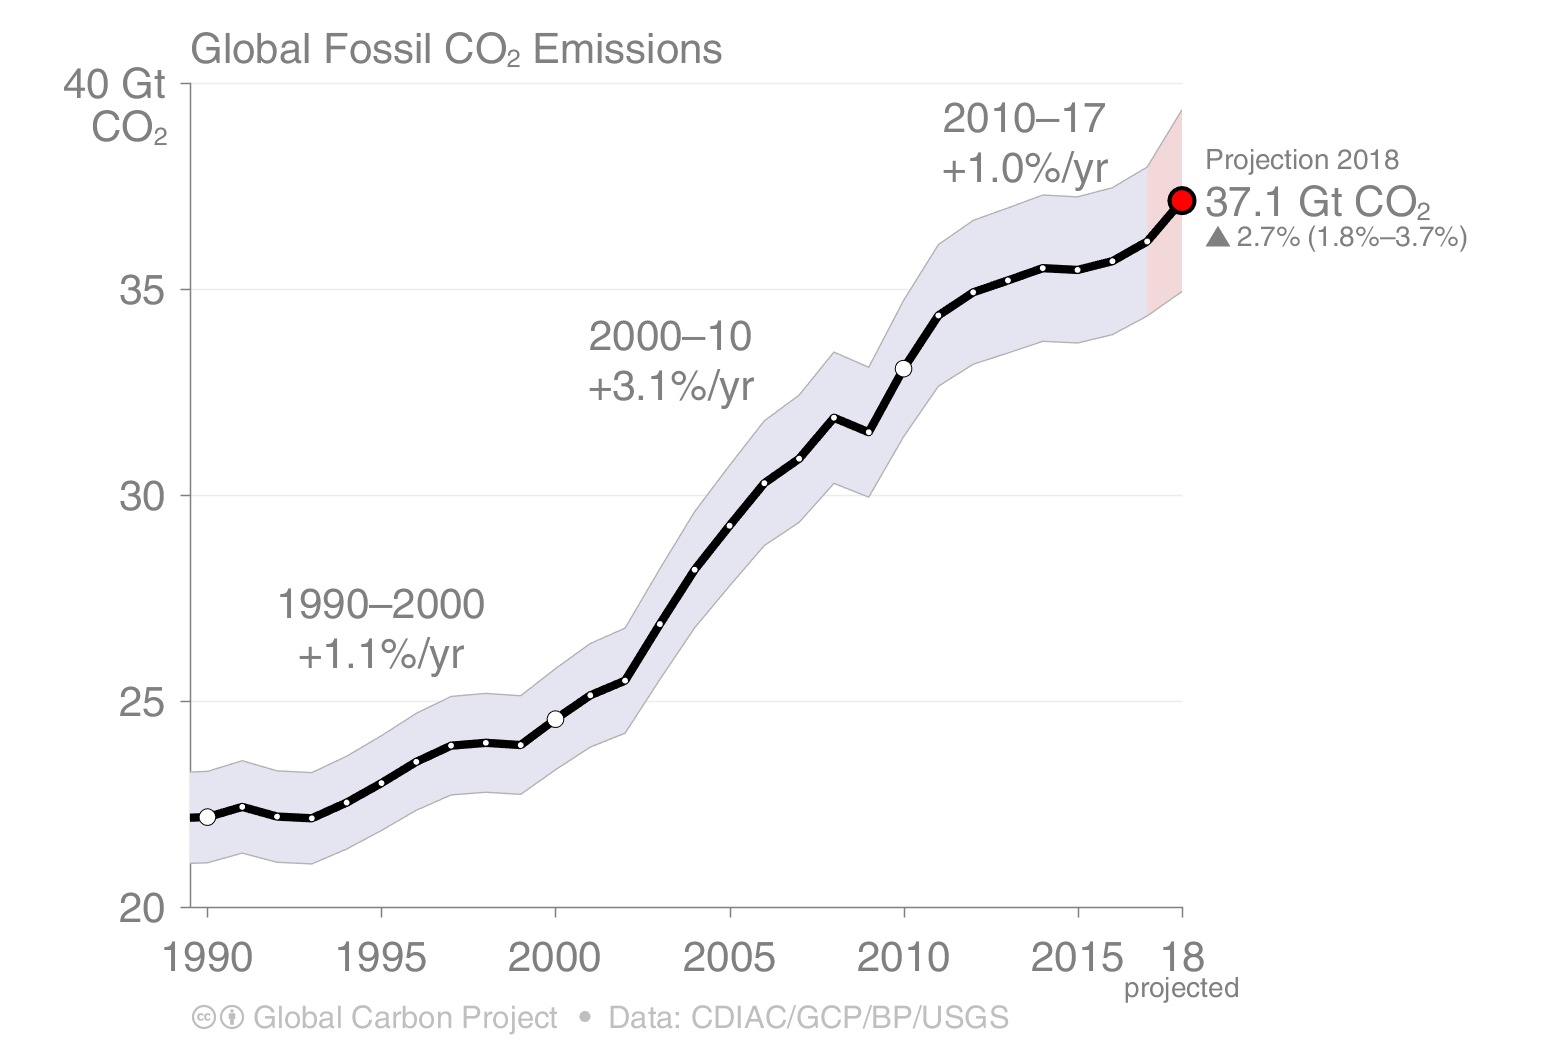
An important fact to be emphasized is that carbon dioxide in the atmosphere just adds up.  So even if we stabilize global production of carbon dioxide, things will just get worse as we add to the total.  For a few years 2014-2016 it looked like CO2 production was stabilizing, but then the trend turned worse, and last year accelerated it.  Here is the current chart.

s09_2018_FossilFuel_and_Cement_emissions_1990

As we just noted, even a stable value of CO2 emission means things are getting worse, because it is the total amount of CO2 in the atmosphere that drives temperature change.  The stable value was attractive, because it seemed to indicate that CO2 had finally peaked and might start to decline.  And the decline might mean the total CO2 could be bounded.  We’re now back to worrying about the peak, with no idea how bad things will get.

Scientists have given us a so-called carbon budget—the maximum amount of CO2 we can add to the atmosphere and still escape dangerous, irreversible changes.  Every bit we add counts against the budget.  We have to find a way to get carbon dioxide production down toward zero, and things will continue getting worse until we get all the way there.   According to the last international climate study, CO2 production needs to drop 45%  by 2030 and reach 0 by 2050 if we want to keep the temperature increase under 1.5 ºC.

– Can’t we just pull the carbon dioxide back out later?

There is currently a lot of work in progress on how to capture and store carbon dioxide.  For now, capturing carbon dioxide even in exhaust flues is expensive—it can double the cost of electricity from a coal power plant.  Pulling it out of the air is substantially harder.  Further some effects, like movement of glaciers, are hard to stop even if we pull out the carbon dioxide later.  Sea level changes are irreversible.

Earliest use of this kind of technology would be for flue-based solutions in particular industries.  That’s getting cheaper, but it’s no miracle solution.  Large-scale pulling carbon out of the air is not yet available, and the cheapest estimates for a worldwide solution would cost on the order of 10 trillion dollars annually.  Nonetheless, current climate models assume that some use of this technology (expensive or not) will be needed if we are to keep the temperature increase under 1.5 ºC.

– What about geoengineering?

This approach, which gets sporadic publicity, involves adding chemicals to the atmosphere to block the sun—cutting temperature by putting the whole world in the shade.  A number of different substances have been investigated to do this, and any of them would need to be constantly injected into the atmosphere under supervision by some international body.

As an approach this is much cheaper than carbon capture, but it is regarded as a dangerous last resort even by the people who do the research.  All photosynthesis worldwide would be affected. The closest natural phenomenon, the Mount Pinatubo volcanic eruption in 1991, resulted in a worldwide drought.  It does not address acidification of the oceans, which would continue to disrupt life in the seas.  Further it is a time bomb, as carbon dioxide concentrations would continue to build up, so that the shading and its effects would have to keep increasing, and any interruption would be catastrophic.

The bottom line is that there is no silver bullet here; we have to get off burning carbon.   However it’s worth pointing out that this is NOT a death sentence (as we’ll see) and it is also NOT committing us all to a grim world of scarcity.  Even today people buy Teslas because they like them—among other things they’re performance cars—not as sacrifices for the good of mankind.  That’s the right way think about the whole transition.

  1. What to do about it

To understand what we need to do about climate change, we first have to think about the kind of world we would be going toward.

A point worth emphasizing is that the future is electric.  If we’re getting off fossil fuels, we’re not going to have people burning stuff all over the place.  So we will be generating power by suitable technology (more on that in a minute), and electricity is the means of storing and distributing that energy.  All renewable sources today generate electricity as the common currency of power.

Since the electric grid is the core for what we need to do about energy, we have two primary tasks:  strengthening the electric grid and getting all users of energy on that grid.  Each needs to be discussed separately.

– Strengthening the electric grid

This is about generating and distributing power.   We of course need a grid that is reliable and safe, but for climate change we’ll need more.  There will have to be considerable growth in electrical power generation (since we’re taking on new roles), and we will want to optimize opportunities for renewables even in the near-term.

At present there are ongoing activities to strengthen our current patched-together national electric infrastructure, but these are long-term projects and not primarily driven by climate change.  Power generation is largely a per-state matter and is quite literally all over the map.  For climate change we have benefited from the near-term improvement of substituting natural gas for coal, but there are still many coal plants and nothing says we have optimized opportunities for renewables.  Ideally we should have a nation-wide plan for growth and modernization that would allow renewable power to be generated where appropriate and used wherever needed.

It’s also worth saying something about the longer-term picture.  Ultimately this is not a story about scarcity and conservation; it’s about alternative power.  Renewables will improve, and there will be other significant new sources of power.  Fusion power in particular has been slow to develop, but should be taken seriously.  It has had a recent impetus with higher-temperature superconductors (for the magnets that contain the fusion reaction), and current international projects target 2033 for a demo system and 2050 for commercial system deployment.  Initial systems will be heat-based, like conventional power plants, but later generation systems may generate electricity directly —a mind-boggling concept.  (Interestingly, this may even involve mining on the moon.)  We have a near-term job to do in saving the planet, but there’s no reason to fear we will ultimately lack for power.

– Making electricity the universal power source

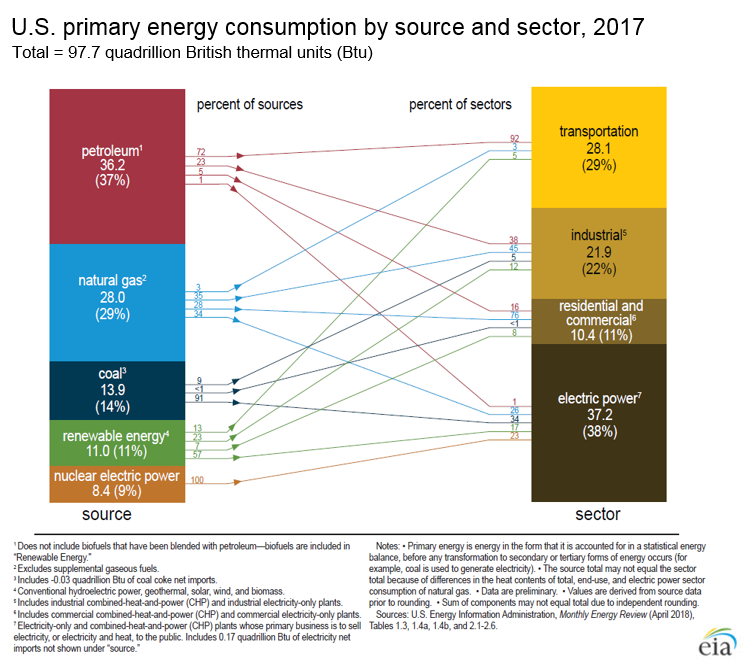
The point of departure here is the following chart showing energy use by sector and energy source.  Our task is a prioritized migration to renewably-generated electricity in all sectors, with the maximum possible bang for the near-term buck.  In this transportation is an obvious target. It is a large consumer of energy (28% of US energy usage) with negligible current penetration of renewables.  Electric cars can be a big win.

consumption-by-source-and-sector

Given the complexity of energy usage overall, the single most important step to encourage migration is to stop pretending that carbon dioxide production is free, i.e. to stop subsidizing the fossil fuel industry.

We can be pretty specific about what CO2 costs us.  We are rapidly reaching the point where each new ton of CO2 in the atomosphere is a ton that will have to be removed.  The cheapest estimates of what it takes to remove CO2 from the air (average of upper and lower bound estimates) is $163 per ton.  Multiply that by the US annual production of CO2 = 5.4 B tons, and the silent subsidy to the fossil fuel people falls out as $880 B annually.  That’s no small distortion of our economy.  Essentially a trillion dollars a year.  Another way to say the same thing (when you work out the math) is that every gallon of gasoline sold gets a silent subsidy of $1.47.

The usual approach to this subject goes by the name of a carbon tax, but that’s actually a misnomer.  A tax is money collected to fund some government activity, and that’s not the point here.   We’re stopping a government-funded subsidy of products that produce CO2, and any money raised should be used to mitigate the effect of fuel price increases on the population.

Because raising fossil fuel prices is regressive, balancing costs and benefits is tricky and has led to voter rejection (spurred by massive Koch campaign spending) of several carbon tax proposals.  (The yellow-vest protest in France was from something worse, a budget-balancing regressive tax masquerading as a climate measure.)  The magnitude of the silent subsidy is such that it is necessary to get this right.

One example proposal worth discussing is the Carbon Fee and Dividend from the Citizens Climate Lobby.  They start with a low fee of $15 per ton of generated CO2 at fuel production or port of entry, but raise the value $10 per year afterwards.  That money gets returned per adult with an added allowance for children.  The gradual increase is in part a low entry but it also allows for increasing maturity of competing technologies.

That proposal is now a bill in Congress, and there was a recent endorsement by a number of economists and other public figures.  It may or may not become part of the Green New Deal from the Congressional Democrats.  One way or another carbon pricing is so fundamental it just has to be fixed.

  1. Outline of a plan

The energy use chart from the last section says a lot about how this has to work.  Going down the chart, we can say the following:

– Transportation

Thus far this sector has had virtually no penetration of renewable energy sources, so its importance cannot be overestimated.   The only alternative is electric power, so we need incentives to finally get a non-trivial market share.  Carbon pricing will help, but we may need more. We’ve had incentives in the past to help electric car makers get into business.   Now the issue is the continuing cost of carbon.

– Industrial

The ongoing migration to natural gas shows the price sensitivity of this sector.  That trend toward gas should continue, and we need to start more movement onto the electric grid.  Carbon pricing should help here too, and there should be active discussion with industry to determine what form it should take.  Flue-based CO2 capture may also be appropriate in some cases.

– Electric power

We already noted the major contribution from this sector in the conversion from coal to natural gas.  That should continue with the non-trivial number of remaining coal plants, but we still have to get to renewables.   Everything that happens in this sector should flow out of a national plan for evolution of the power grid, as discussed before.  Coal plants and also gas-powered plants may be supplanted by renewables elsewhere.

– Residential and Commercial

We should recognize that this sector is significantly smaller and with many subsectors to be considered.  The conversion to natural gas is already well-underway and the remaining petroleum sectors (e.g. New England) may not be easy to change.  So we need to map out conversion to electric or possibly even flue-based CO2 capture.   The first step is a more detailed plan.

We also need to call out the need to support research, as it is an unavoidable part of the picture.  That applies both for new energy sources and storage, and to the various activities underway to understand climate change and how we will have to adapt.

  1. International coordination

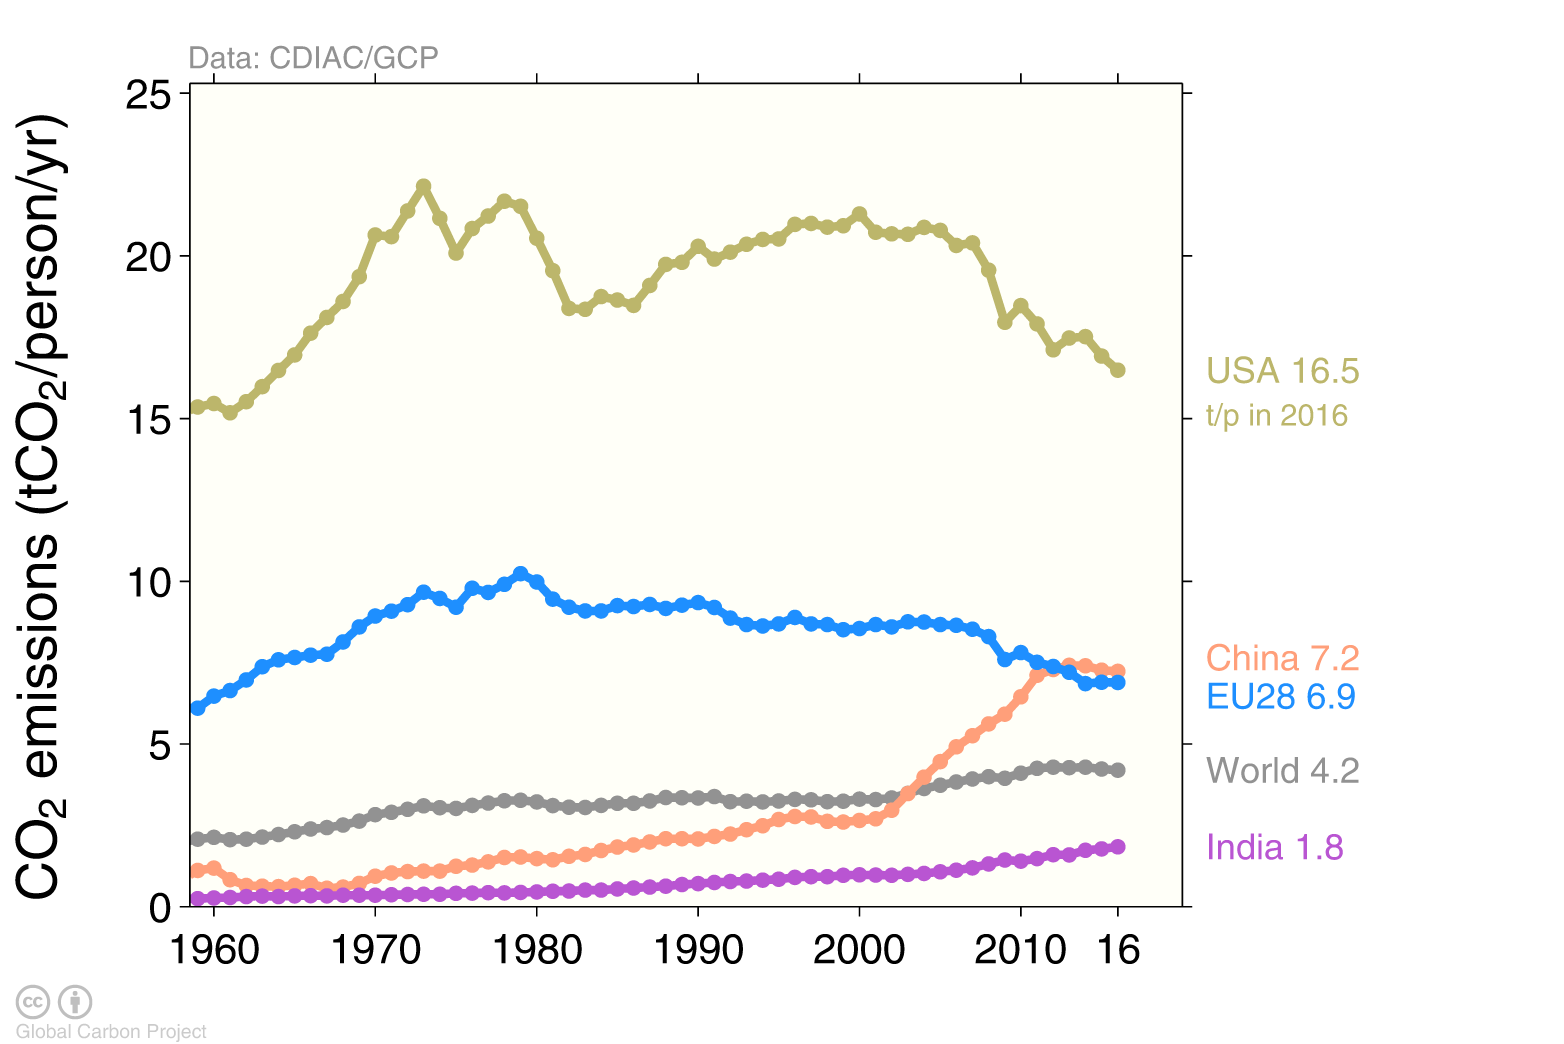
Thus far our discussion has focused on the US, but we’re only one piece of the puzzle.  Despite the nationalist rhetoric, there is only one atmosphere for everyone.   Helping other countries helps us, and poorer countries have fewer resources.  The following chart underlines the importance of that effort—the “others” are becoming the biggest piece.

s11_2018_Projections

There are actually two points to be made.   First, the Paris Agreement included an initial arrangement between rich and poorer countries, so that progress could be made.  That codified a fund (trashed by Trump) to help poor countries meet their targets.  However the issue will continue to be contentious, and one way or another we will have to contribute.  The just-completed Madrid meeting ended without agreement.

Second, our contribution may turn out to be more than just money.  Other countries will have energy use charts that won’t look anything like the one we’re been considering.  They may need different forms of technology to support different evolution plans.  We should use our resources to see what can be done.

In the past the US recognized a responsibility to lead this process.  With the US now firmly committed to cheating, it’s hard to keep things going.

The world needs our contribution to leadership. That means it is doubly important to put our own house in order .  We need to know where we’re going for ourselves, and so that we can help the rest of the world in this effort to preserve our common future.

Tesla as Example

41318617150_f5b1078ab5_z

However distasteful Elon Musk seems to be, the nuttiness of Tesla’s treatment nonetheless deserves comment.

Tesla was the first (as far as I know) to figure out that current battery technology is practical to power a car.  They have also been the best thus far at figuring out how such a car can be made uniquely attractive.

This is an intensely competitive business, and they have been trying to maintain first-mover advantages in features, battery technology, and the manufacturing process.  That is a very tall order, and it involves enough risk-taking that there is no surprise that it is tough to keep commitments.  Until they reach some sort of stable state vis-à-vis their auto competitors, Tesla has to be regarded as still in a kind of startup phase.  That applies both to risks and rewards.  No one expected iPhone penetration to grow as fast as it did (I can still remember articles talking about mobile phones as a mature, saturated market), and the same kind of thing could happen with electric cars.

Unless you’re a deliberate non-believer in climate change (and these days you have to try hard), the role of electric cars can hardly be overestimated.    Transportation accounts for 28% of carbon dioxide production, and there is no one proposing to put carbon dioxide scrubbers in every car.  Tesla is trying to become the Apple of transportation, with perhaps an even bigger impact on the US economy.

How are we helping Tesla in that undertaking?  Well, we haven’t cut out the electric vehicle subsidy entirely (as the House Republicans proposed to do), but there’s no evidence we’re trying very hard either. The administration is just not interested in anything that raises even the suspicion of climate change.  A carbon tax for example.  We are minimizing Tesla’s value in its home market, while the rest of the world catches up.

As for the business community, everyone seems eager to predict the Tesla’s demise.  Certainly the traditional auto companies would like that, and Musk’s antics make it exciting for the press to think about a deserved fall of arrogance.

However as an indication of what that might mean, people should recognize that all of the core technology in the Chevy Bolt comes from South Korea.  And that story can hold for the rest of the multi-trillion-dollar investment that will be needed to combat climate change.

Hurricane Harvey and the Burden of Proof


Hurricane Harvey was an extraordinary event.   The rainfall totals and flooding were without precedent even in the hurricane-prone Texas Gulf region.  The New York Times pointed out that fully 40% of the flooded buildings were in areas classified as “of minimal flood hazard.”

Scientists have been very circumspect about what part of this to attribute to climate change.   Michael Mann gave a careful summary of contributing factors, principally sea-level rise and water temperature.  The message is that climate change didn’t cause the hurricane, but did make it worse.  No one can quantify just how much worse, and certainly out-of-control development in Houston contributed to the destructive effects.

However, the fact remains this was an unimaginable storm.   It was out of the range of what anyone thought to see from weather, even from hurricanes.  That is the threat of climate change.  Weather isn’t limited to what we know and understand.  Once we perturb the system, the power of the elements can surpass anything we are used to—that is what’s at stake.  We can’t even guarantee the changes will be gradual.

The evidence behind climate change is considerable and increasing.  A previous post here discussed one particular way of looking at it.  Any reasonable business, faced with a risk of this magnitude, would be doing its best to quantify that risk, so as to take appropriate action.   Businesses that choose to ignore disruptive new technologies or entrants are the ones that disappear—along with their disparaging comments on how the new stuff will never amount to anything.

That’s us.   Coal and oil interests (Koch brothers and their cohorts) are horrified that anyone would even think about keeping their assets in the ground.   With this administration anything that any business doesn’t like is bad–and for climate change we actually have Koch representatives (Scott Pruitt, Mike Pence) running the show.  So climate change doesn’t exist.  Can’t even talk about it.   Come back to me when things are so bad I can’t laugh at you.

What is the burden of proof here?  We are long past the stage of serious concern.   We haven’t reached the stage where people with something to lose are ready to give in, but that’s not going to be until their businesses blow up in a storm.   With climate change you have to act early if you want to prevent a future of weather run amok.   Carbon dioxide in the atmosphere just adds up.  If you wait for things to get bad, they will go from bad to continually worse through all the years it takes to get off coal, oil, and gas—and then stay that way for many decades more.

We are at the stage where the appropriate response to risk is action.  Research and the Paris Agreement process are imperatives.  CEO’s of failed companies can always go on to the next one, but with climate change there’s nowhere to go.

Forecasting Climate Change

This note is an introduction to the task of forecasting climate change.  It avoids most details of the climate simulation models, but it does try to give a feel for what we know and why.  This fits with the previous more general post on climate change and the Paris Agreement.

At its basis climate change is straightforward:  the burning of fossil fuels puts extra carbon dioxide (CO2) in the air.   That raises the concentration of CO2 in the atmosphere.  And that in turn causes temperatures to rise.

You can go a long way with just that, but as we’ll see the story is ultimately far from simple.   The story here has two parts:

  1. Projecting historical trends
  2. New factors in a warming world

The two parts are quite different.   The first identifies clear patterns from the data going back over the past 70 years.   The second is necessarily more difficult, as it covers new phenomena resulting from climate change itself.  The first functions as a baseline, with the second adding new effects to the base.

Part 1 – Projecting historical trends

The point of departure here is the correlation of CO2 in the atmosphere (in “parts per million”, abbreviated ppm) and temperature change.  The following slide shows how that looks over time.  (“Temperature anomaly” just means temperature rise since the start of the industrial revolution.)  The temperature rise and CO2 concentration are clearly tied closely together.

Figure 1

Forecast1


We can do better than Figure 1 however, just by explicitly correlating annual temperature values and CO2 concentrations.  We use online data from 1959 to 2016 for the calculation, taking temperature values from here and CO2 concentrations from here.

When we plot it up, the result is a remarkably clear trendline:

Forecast2

In the trendline the temperature value y (in degrees C) is related to the concentration x (in ppm) by the equation y = .0105x – 3.3886.  The slope .0105 is particularly important.  It says that on average whenever the ppm value increases by 1, the temperature increases by .0105 degrees Centigrade.   As in the previous chart the temperature scale here shows degrees above the pre-industrial world temperature (i.e. the temperature pre-1880).

(To be clear, the linear relation between temperature and ppm is remarkably obvious in the data, but not a surprise.   The temperature rise comes from reflection of infrared radiation back to earth.  The probability of that happening is the probability of radiation interacting with a CO2 molecule–and that is proportional to the concentration of CO2 in the atmosphere.)

We have now have a precise statement of how CO2 concentration changes affect the temperature.  The next step to see how the CO2 production affects those concentration changes. For that we need another slide as introduction.

Figure 3

Forecast3

What this says is that the first thing to understand about the effect of CO2 production is how much CO2 actually ends up in the atmosphere.  We’ll talk about each side of the slide separately.

The left side points out that CO2 from fossil fuel burning is only 91% of the total, because there is another factor that is completely different—deforestation and similar land use changes.  For our purposes we will simply inflate our production number by 10% to get to the correct total.

The right side then points out that of the total (inflated) production number, only 44% actually stays in the atmosphere.   The rest is absorbed by trees and oceans.

Hence we have the simple equation:

CO2 added to the atmosphere = CO2 produced x (1.1) x (.44).   (For what follows you should know that CO2 production is reported in “gigatons”, abbreviated Gt.)

Next we need to get from gigatons of CO2 in the atmosphere to CO2 concentration in ppm.   That, however, is just physics—counting molecules in the air—and it has a standard answer:

Increased CO2 concentration (in ppm) = Added CO2 (in Gt) / 7.81.

(To be precise, the reference gives the equation: extra CO2 ppm = added carbon / 2.13.  To get the equation for CO2 instead of carbon, you correct for the relative atomic weights of CO2 vs carbon.  Since CO2 has two oxygen atoms in addition to carbon, that means 2.13 is replaced in the formula by 2.13 x 44/12 = 7.81)

Putting the two equations together we get this simple relationship:

Increased CO2 concentration (in ppm) = CO2 produced (in Gt) x (1.1) x (.44) / 7.81.  That is

Increased CO2 concentration (in ppm) = CO2 produced (in Gt) x (.0614)

Since annual CO2 production figures are also available online, we can actually verify this result using real data.  The following figure gives the result (computed using rolling 5-year averages for the annual incremental ppm):

Forecast4

As before slope of the line is most important, because it gives the added ppm resulting from a 1 Gt of CO2 produced.   In other words, .0625 is the observed value corresponding to the theoretical .0614 we just mentioned.  Remarkably close given all the factors involved.  (As additional confirmation, it should be noted that there are even studies based on carbon isotopes identifying the extra CO2 in the atmosphere as coming specifically from burning of fossil fuels.)


We can now put the two stages of our argument together.

We have found two results:

  1. For each additional Gt of CO2 produced, the concentration of CO2 in the atmosphere increases by .0614 ppm.
  2. For each concentration increase of 1 ppm, we get a temperature increase of .0105 degrees C.

Putting those together we get:

For each Gt of CO2 produced, the temperature can be expected to rise by .0614 x .0105 = .0006447 degrees C.  You can’t get much more explicit than that.


Using that formula we can establish a baseline for climate change.

First we need to clarify that the 2 ⁰ C upper limit in Figure 2 was there for a reason.  For quite some time, a 2 ⁰ C temperature increase has been regarded as a tipping point, where temperature-related changes become both serious and irreversible.  For that reason the Paris Climate Agreement is targeted specifically at avoiding a temperature rise of that magnitude.  (More details on the tipping point can be found here.)

First question:  how much more CO2 can we emit before we hit the limit?

In stating this question we have implicitly used an important fact about CO2 that underlies much of the analysis of climate change:  carbon dioxide stays in the atmosphere for decades, so long in fact that for analysis purposes we can assume it just adds up.  For that reason the IPCC (“Intergovernmental Panel on Climate Change”—the key international research body for climate change) refers to a so-called “CO2 budget”.  The CO2 budget is the amount of carbon dioxide you can put in the atmosphere and still stay under the 2 ⁰ C target temperature limit.  The idea is that it doesn’t matter when or how you do it, that’s the budget you’ve got.

For 2016 the current world temperature was estimated to be .99 ⁰ C above the per-industrial level.  Since we are at .99 ⁰ C above the pre-industrial value, we are 1.01 ⁰ C from the limit value of 2 ⁰ C.

From our final equation we have as baseline

(Gt’s to get there) x .0006447 = 1.01 degrees.   So the limit is = 1.01/.0006447 = 1567  Gt’s of CO2.

Next question:  How long will it take to get there at current production levels?

To answer that we need to look at the following chart of historical CO2 production levels:

Figure 5

s08_FossilFuel_and_Cement_emissions


At least for now production seems to be stabilizing, so we will use the 2016 value of 36.4 Gt for the annual CO2 production.  With that we get, again as baseline,

Time to 2 ⁰ C limit = 1567/36.4 = 43 years.  So if nothing changes we hit disaster in 2059. (Of course avoiding disaster means acting earlier.  We’ll return to that later.)

What this number means

As we’ve been careful to say, this isn’t the whole story.   However what it does say is that the trend of the last 70 years is unambiguous and specific.   It yields a carbon dioxide budget and a date to reckon with.   Even this most straightforward calculation says we have a serious problem.

The reason that isn’t the whole story is that climate change itself has produced new phenomena that add to the baseline.   Examples include

– Temperature change in the oceans

– Acidity change in the oceans

– Decline in arctic sea ice

– Melting of ice caps

– Melting of permafrost

So before we can be precise about carbon budgets and timeframes we need to incorporate the effects of these new kinds of changes, because it all adds up.

Since this is new territory, we can’t rely on history for this new piece.   It requires both new science to understand the effects and new simulation models to track their interactions.   That effort is the subject of the next section.


Part2 – New factors in a warming world

For the newer changes to the environment, the only way to understand the future is to learn enough to model the actual behavior.  That effort is a major goal of ongoing climate science.

Then, since the effects are linked with each other, they must be tied together into a simulation model of the natural environment.   Of necessity, this must include not only the atmosphere but land and water effects as well.  The IPCC currently has four major simulation projects, to model scenarios with low, medium, and high levels of retained heat in the atmosphere.  Those simulations are enormously complicated; they model specific per-year patterns of greenhouse gas generation in particular geographic locations with associated ocean currents, forests, glaciers, and so forth.

While the complexity of the models is beyond the scope here (see this overview for a summary), what we can do is describe some of the issues that are modeled, with an indication of ongoing work to support the results.

We should also underline the importance of this work.   Because warming trends already put us in new territory, there is no history to estimate or even bound the magnitude of these new interrelated effects.  Without looking in detail, we just plain don’t know what is going to happen.  One sobering lesson from the longer historical record is that with climate, small changes can produce big effects.

With that as introduction, we now look at some of the important issues under study.  In this we’ll see how the changes mentioned earlier actually come into play.

CO2 uptake in the oceans and on land

As we noted earlier, only 44% of the CO2 that is produced ends up in the atmosphere.  The following chart shows how that has evolved over time.  What gets into the atmosphere is what isn’t captured by the ocean and land sinks.

Figure 6

Forecast6

Any change in the absorptive capacity of the ocean or land sinks has a big effect on climate, by multiplying the impact of whatever carbon dioxide is produced.  And there have been concerns, particularly recently, that the absorptive capacity may be reaching a saturation limit.  So there is considerable ongoing work to understand the mechanisms responsible for the uptake.

For the oceans the story turns out to have several parts:

– The oceans are warming, and warmer water has less capacity for CO2.   That part is relatively easy to quantify.

– A large part of the uptake, however, is due to photoplankton in the water.  It turns out that there are multiple species and issues to be understood.  Very significantly, the photophlankton are sensitive to the rise in acidity of the oceans.   So there are a quantifiable scenarios where rising acidity will reduce the ocean uptake by killing photoplankton.

– Additionally, all of the ocean uptake involves a relatively thin layer of surface water.  That upper layer is refreshed by the operation of ocean currents.   As we’ll discuss in a minute, the currents themselves are vulnerable for disruption by climate change, so refresh rates will change in some scenarios.

For land sinks the story is simpler—threats to forests from rising temperatures, and new forest areas created by natural or artificial means.  Note that the land sinks have been historically volatile, as you can see in Figure 6, so modeling has to be explicit and detailed.

Melting ice caps

One of the most obvious effects of climate change has been the melting of ice caps and glaciers in Greenland, Antarctica, and elsewhere.   This melting contributes to warming by reducing reflectivity of ice-covered surface, but can later increase carbon uptake if the glacier is replaced by forest.  Both effects are included in the models.

Glacial melting now appears to be happening faster than expected, so there is active work on the timetable.  The melting also affects the salinity and therefore density of the surrounding water, which in turn can affect ocean currents.  And that, as we just saw, affects ocean uptake of CO2.

It should be noted that melting of glaciers is one of the longest lasting effects of climate change.   Once ice sheets begin movement toward the sea, the process becomes virtually unstoppable.  Which means locking-in many meters of sea level rise in long-term projections.  The Greenland ice cap alone represents 7 meters of sea level rise.

Ocean currents

Over the past few decades, it has become clear that ocean currents are linked with each other in a more comprehensive way than was understood before.  The current view (the “ocean conveyer belt” or “thermohaline circulation”) is shown in the following simplified figure.

Figure 7

Figure7

What is relatively new is the notion of deep water currents connecting surface flows—so disruption of any part of the circuit affects the flow overall.

Disruption of the circuit has many consequences.  We have already seen it can affect carbon dioxide uptake by the oceans.  It also affects upwelling of nutrients and hence most life in the oceans, as well as the weather worldwide.

One important special case is the down-welling in the north Atlantic, in that it appears to be affected by melting of the Greenland ice cap.   That directly impacts the Gulf Stream, but the via the “conveyer belt” the effects would be felt worldwide.   Details are described here.

Other greenhouse gases

Thus far we have talked only about CO2, because its residence time in the atmosphere is much longer than for other greenhouse gases, such as methane.  Methane, however, is much more potent molecule-for-molecule, so there are examples where it needs to be taken specifically into account.

One such example is permafrost melting in the Asian tundra.   Since permafrost is partially-decayed vegetable matter, melting of permafrost actually releases methane directly.   The methane only persists in the atmosphere for about a year, but because of its potency it creates a short-term effect on climate that has been incorporated into the models.

Note that because permafrost is a phenomenon of the tundra, this is a case where the models need to react to the specific effects in particular geographic regions.

Cloud cover

Cloud cover is a surprisingly contentious subject.  On one hand it is nothing new, so in that sense it is already in the baseline.  On the other, it has such large potential effects both positive and negative, that it is hard to dismiss as something that might fundamentally change.

The basic arguments are straightforward:   clouds reduce warming by reflecting sunlight back but they also trap heat coming from the earth.   In general for high clouds the warming effect is predominant and for low clouds the cooling effect is.

There has been considerable effort to decide upon the net effect, which for now appears weakly warming.

Carbon capture

Carbon capture is a technological idea that has been around for some time without ever maturing to the point where it can be called real.   The idea is that CO2 would be captured at emission or even removed from the atmosphere and either stored somewhere (underground or at the sea bottom) or handled by a biological process that would render it harmless.

Anyone who thinks the current IPCC models are deliberately alarmist should realize that the models actually include carbon capture technology starting as early as 2030.  As this indicates, the models are in fact a best shot at the future and should not be thought of as a worst case.

Darken the sun

Finally, as a last item, we mention one more category of climate work that does not fit in the IPCC models.  These are the speculative “if all else fails” projects.   They are directed to the case where the IPCC process has failed, and the world is locked into an unlivable future.  For that case they propose gases or particles to be dispersed around the earth to cut down the strength of solar radiation.

While such projects turn up occasionally in the press, all of them have very serious downsides—to start with they reduce photosynthesis and hence food production everywhere on earth—and the people working on them recognize that explicitly.  It is important to realize those are not alternatives but risky and desperate measures for a future we are trying to avoid.


That ends our short summary of modeling issues.

While we have given only a few examples, it should be clear that the effects are potentially large.  And we see that in the last IPCC report from 2014. (That was the 5th such report.  The next one is scheduled for 2018.)

By incorporating all effects, the IPCC’s carbon dioxide budget drops to about half of the baseline–800 Gt starting from the end of 2014.  That means the time to exhaust the CO2 budget is also about half—twenty years.  The specific effects are described in some detail in the IPCC report itself.

Figure 8 presents the IPCC conclusions as a single key chart.

Figure 8

s51_JacksonBridge15_Fig1_lines

The chart shows that with current fuel consumption (black curve) we will get to 2 degrees C in about 20 years, but in that scenario the temperature just keeps rising afterwards. If we want to stay below 2 degrees C, we need to be cutting carbon dioxide production much sooner, about 2020 in the -4% per year scenario.  Recall that since CO2 just adds up, things only stop getting worse when we are essentially done with coal, oil, and gas.

That summarizes the scientific consensus.  Time is short to stay under the 2 ⁰ C limit.  But as discussed in the overview post on climate change, getting there requires action but not miracles.

To end, it is worth emphasizing the importance of research going forward.   There are two points:

1. The world’s climate has already changed in unprecedented ways, and we’ve had little time to understand all its new workings and dangers. This is a very complicated system, and we have perturbed it in a significant way.   There are no guarantees that all changes will be gradual.  The world needs the most accurate possible view of the future.

2. For the transition from fossil fuels—we’ve said we don’t need miracles. But it’s a big job to do, so the more we know the better!


Urgency on Climate Change

There is no special event triggering this note, just a feeling that the urgency behind climate change action is somehow getting lost.

To start with, there’s one part of the science that everyone needs to know.  Carbon dioxide, the primary factor in climate change, remains in the atmosphere for many decades.   For practical purposes, all the carbon dioxide from burning coal, oil, and gas just adds up.

As a consequence, even with a world really ready to act on climate change, things will continue to get worse through all the years while we try to get fossil fuel usage down to zero.   And it will stay that way for many more decades afterwards.  The commitment has to be made with enough lead time–or it will be too late.

The Paris Agreement was never intended as more than a first step.  At the current stage, the Paris Agreement is effectively a vehicle by which we are getting China and India to stabilize fossil fuel use at a per capita value far below ours–for the benefit of the rest of the world including us.  The following figures give the aggregate and then per capita carbon dioxide production by country.  Note the sharp rise and recent stabilization in China on the first chart and the high US curve on the second.

s11_Top_FF_emitters_abs

s12_Top_FF_Emitters_percapita

Current commitments do not get all the way to the Paris Agreement’s goals, but those are only first steps in an ongoing process.  Our exit from the Paris Agreement deliberately undercut the international unanimity that was doing the job for us.

What’s more, for initial steps on climate change, the world and the US in particular have gotten lucky.  The now large-scale production of recently-discovered American natural gas means that we can get a 50% reduction in carbon dioxide production—as compared with coal–without trying very hard.  (Coal is all carbon, so burning it produces just carbon dioxide.  Natural gas is half hydrogen, so half the output is water.  Note that the same logic shows that for climate change there is no such thing as “clean coal”.)

There is in fact an ongoing conversion to natural gas.   Despite our Paris Agreement rhetoric, we don’t have a problem meeting near-term climate goals–much of it is already happening based in part on the price of gas.  But by promoting coal use domestically (and weakening environmental rules for natural gas producers) we insist on creating problems for ourselves and–worse–sending a damaging message to others.  To be clear, natural gas is only a half-step (and a risk for encouraging the producers), but it is buying time for renewable sources to be more widely deployed.   The Paris Agreement goals require an ongoing commitment–but not miracles.

The following figure shows our status now.   After many years of increase, global carbon dioxide production has been stabilizing.  However the only year of decrease is still the 2008 crash.s08_FossilFuel_and_Cement_emissions

Scientists have given 2 degrees Centigrade above pre-industrial temperatures as a tipping point, where temperature-related changes become serious and irreversible.  (See here for a good summary of the scientific consensus, here for a blog post on forecasting.)  This is not something to be laughed away.  We are now at 1 degree. The next chart shows that with current fuel consumption (black curve) we will get to 2 degrees in about 20 years, but in that scenario the temperature just keeps rising afterwards. If we want to stay below 2 degrees C, we have to start cutting carbon dioxide production much sooner, about 2020 in the -4% per year scenario. And that means every country in the world has to keep at it every year —hence the importance of unanimity in the Paris Agreement process. Things only stop getting worse when we are essentially done with coal, oil, and gas.

s51_JacksonBridge15_Fig1_lines

Notice there are no winners and losers with climate change.   Either we stop using fossils fuels or we don’t.  If we do, then we can stabilize the temperature, and it is to everyone’s advantage to keep it under 2 ⁰ C.  If we don’t, then temperatures will continue to rise, and there will be nowhere to hide.

That’s the situation.  There never was any hoax, conspiracy or political game playing—95% of climate scientists worldwide support this.  Try to get that kind of agreement on any subject.  Read this if you want the history.

The bottom line is that climate change is more urgent than we like to think.  It is natural to want to wait and see how bad things will get.  But this is a not a case where that works.  If we wait for symptoms of warming to become our top priority it will be too late.  We will be locked-in as carbon continues to add up, bringing years of increasingly disastrous change.   This is like cancer—first symptoms may be bearable, but if you don’t act now it’s all over.

We need to do everything possible to prepare, and that’s a big job.  We need research both on climate change itself and on everything to do to counteract it.  Industry and government need to prepare for a major transformation, and we need to get back to productive engagement (for our benefit) to finish the job started by the Paris Agreement.

It may be a big job, but it is our role to play, and there is no barrier–other than inaction–to getting it done.